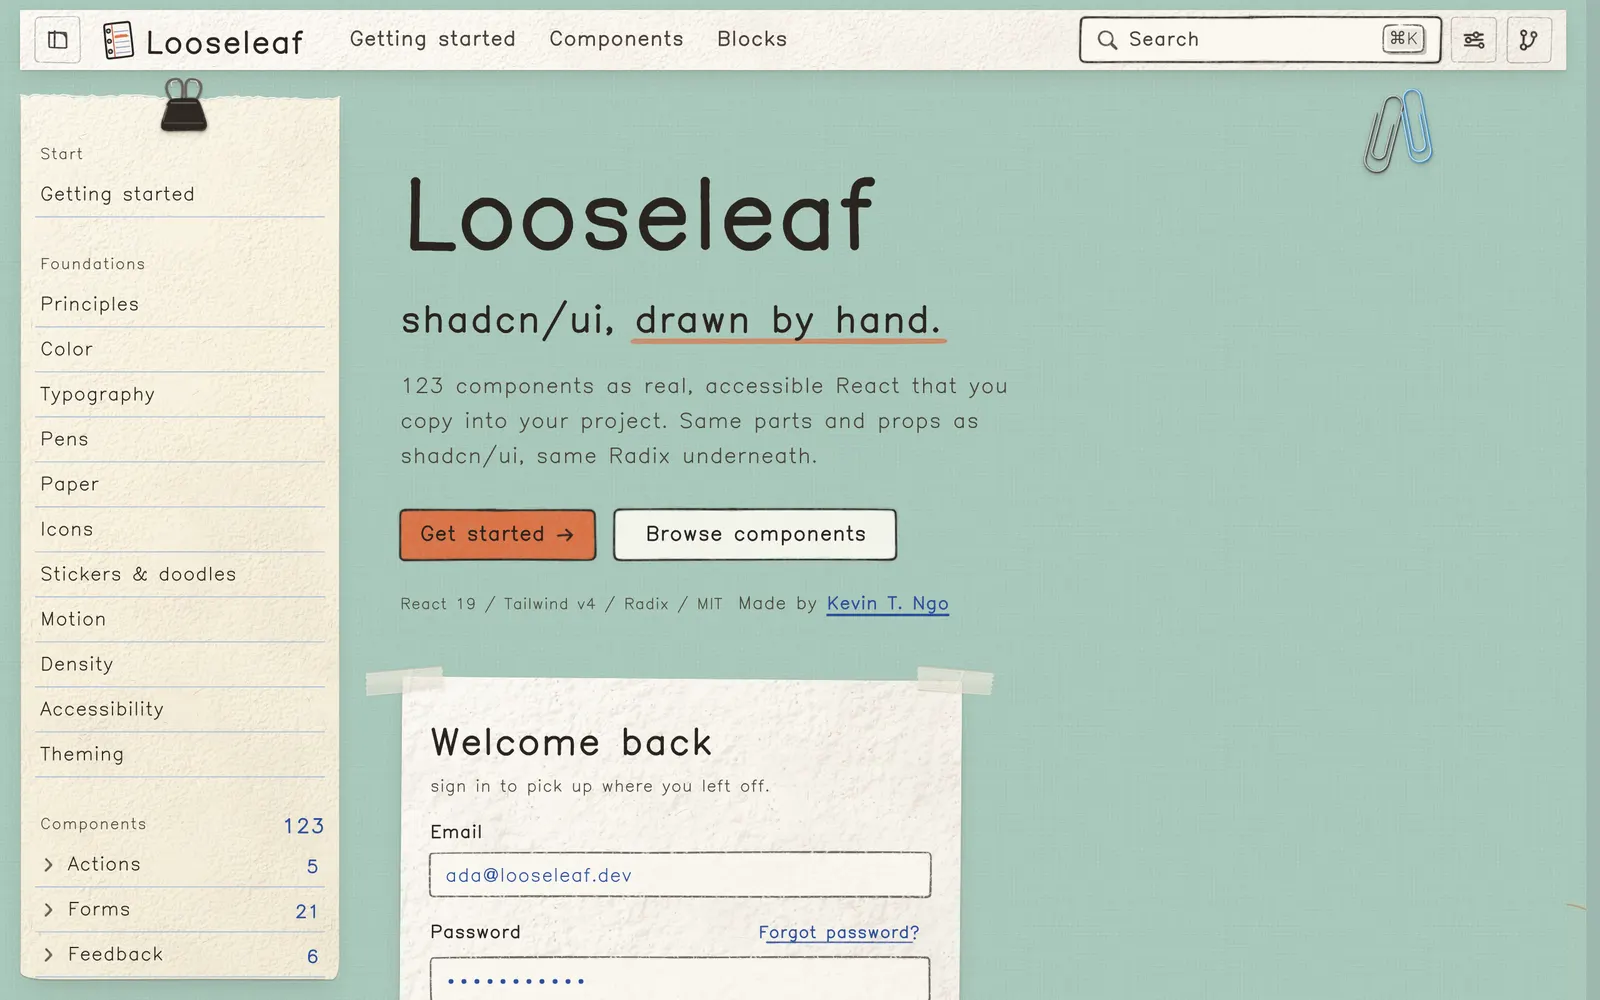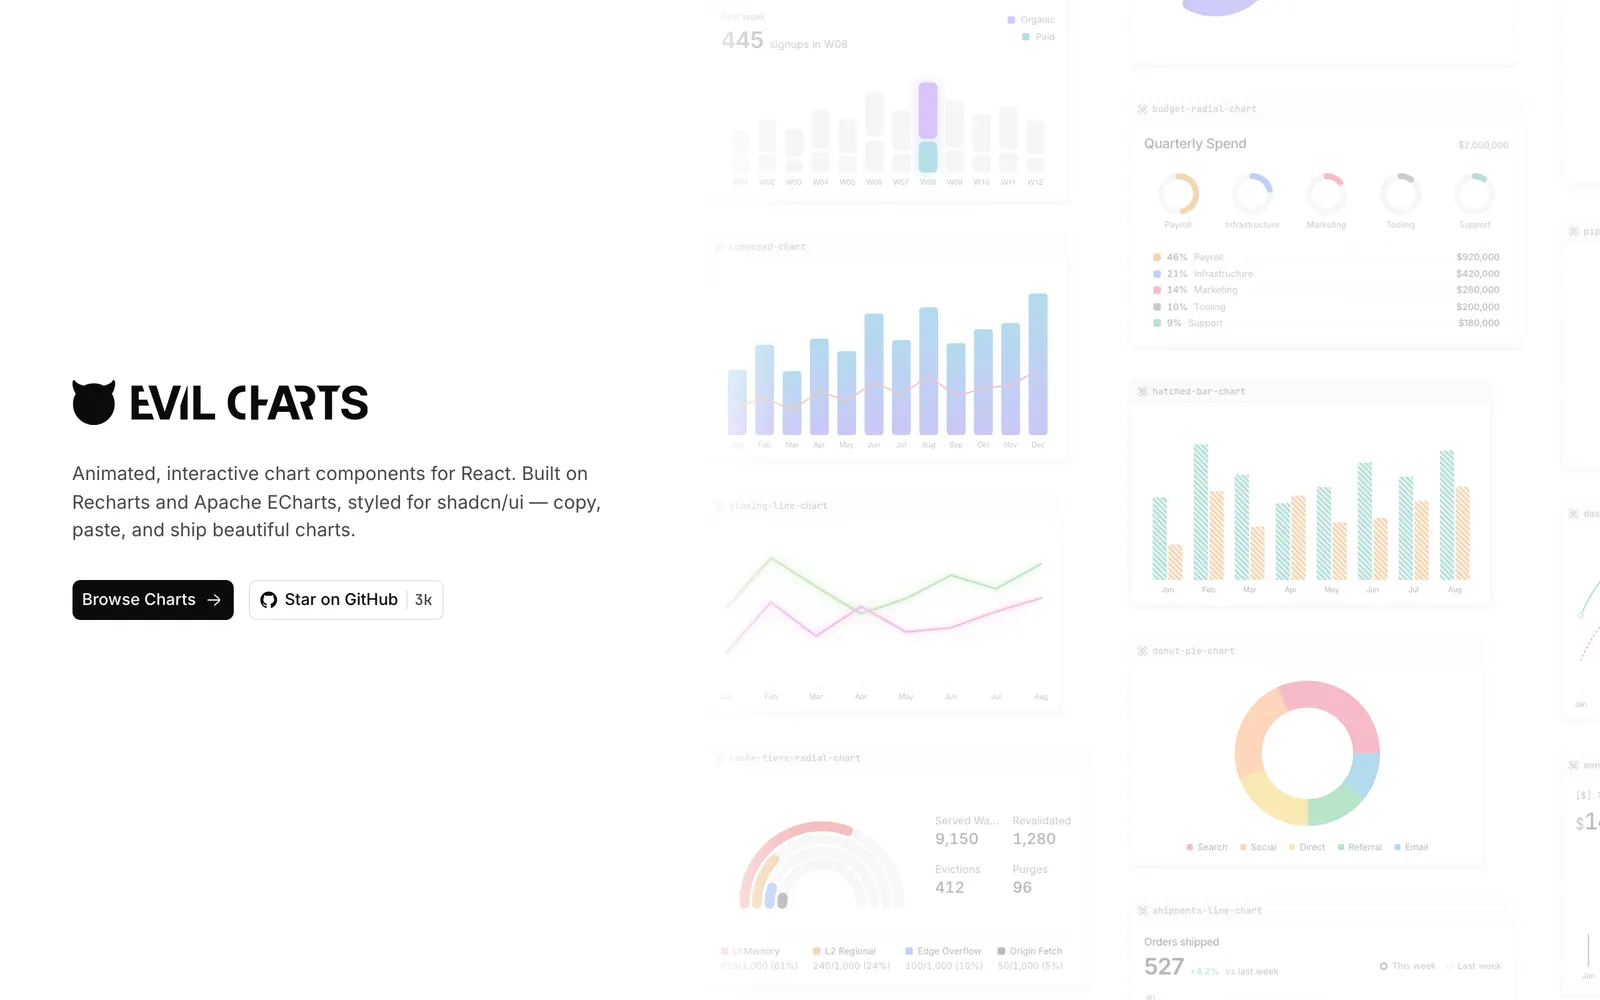
Animated SVG charts designed specifically for shadcn/ui with minimal weight.
Included Components
25
Get StartedComposed ChartRadar ChartTooltipLegendDotsBrushChart ConfigBuilt by GurbinderRechartsApache EChartsShadcnThe ProblemGurbinderWhy I named it EvilCharts?MotionTwo engines, same chartsEChartsWhich one?Documentation IndexAnimated Line ChartGlowing Area ChartMinimal Bar ChartInteractive SVG TooltipSparkline Indicator
Evil Charts is an expressive, ultra-lightweight SVG chart library created by Evil Martians. Tailored to drop into shadcn/ui projects without heavy chart framework baggage, it delivers crisp line charts, glowing gradients, animated tooltips, and bar visualizations with pure SVG and CSS animations.